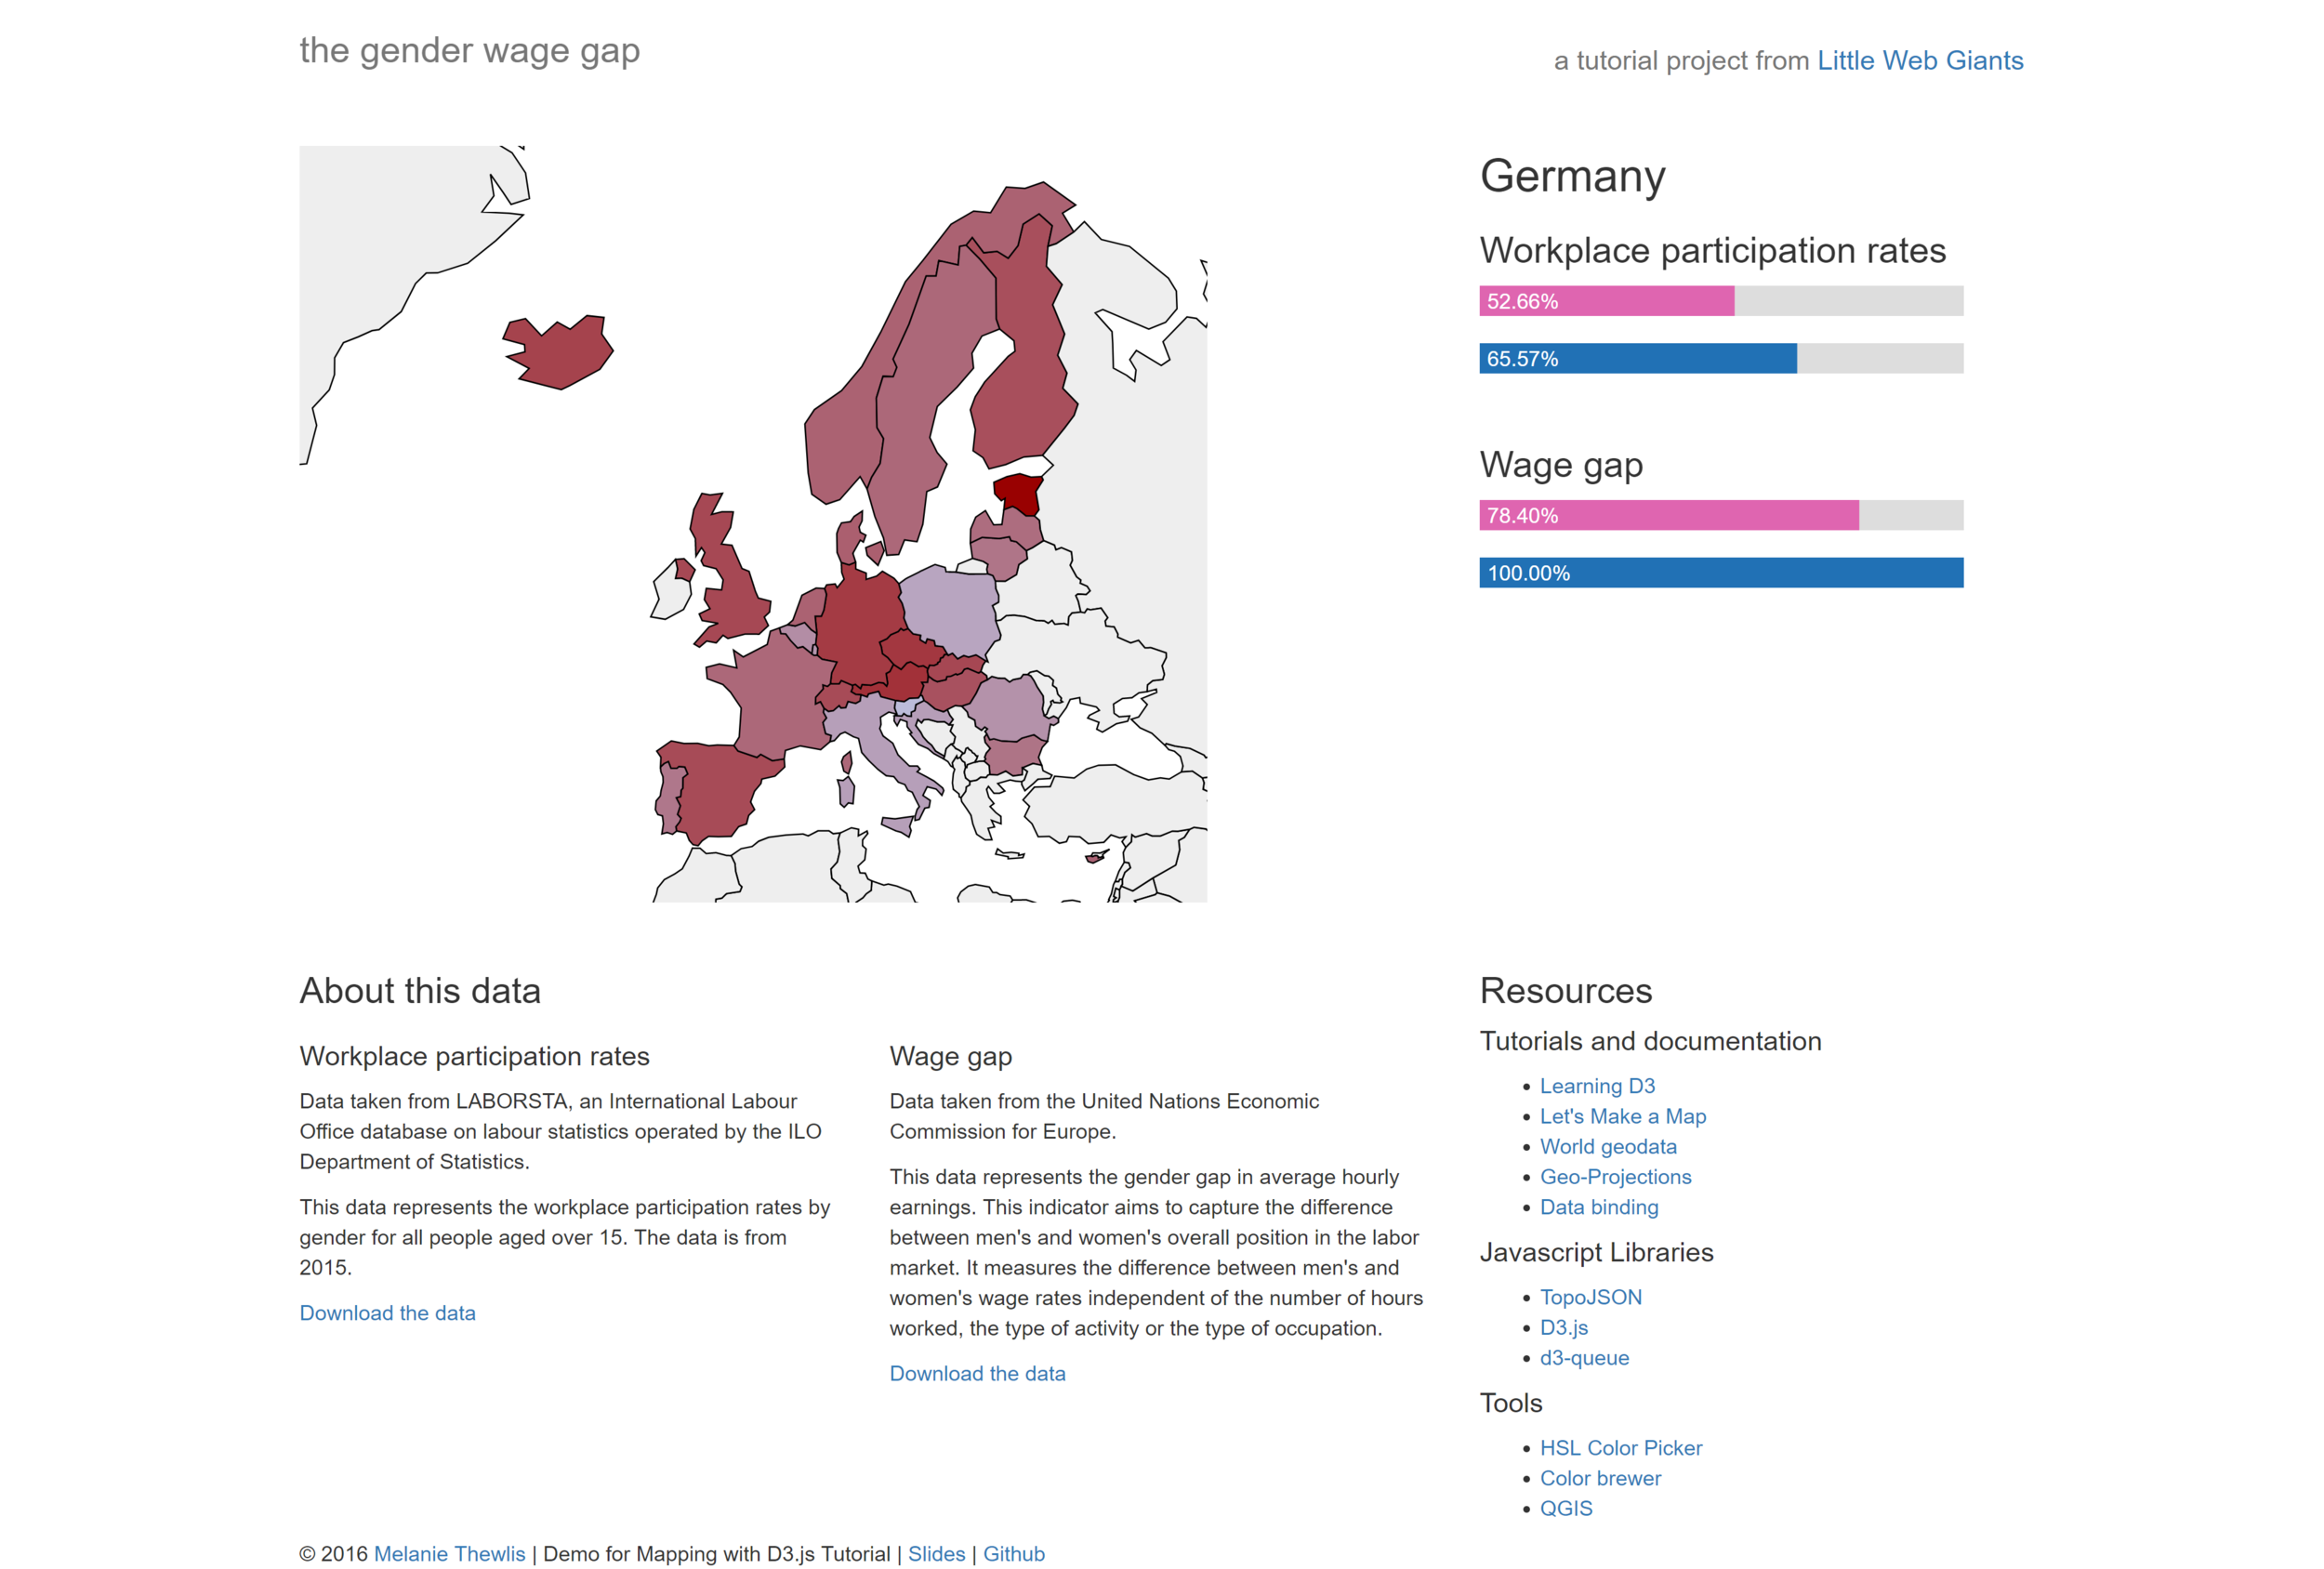
This tutorial was developed to present at the BerlinJS meetup in 2016. It covers the basic steps in scaffolding a simple web app, finding and cleaning data sources, and displaying the data on an interactive chloropleth map. You can find a demo of the tutorial code here (and also embedded below) and a pdf with all instructions here.